From 16.8% to 7.47%: U.S. Old Car Loan Rates

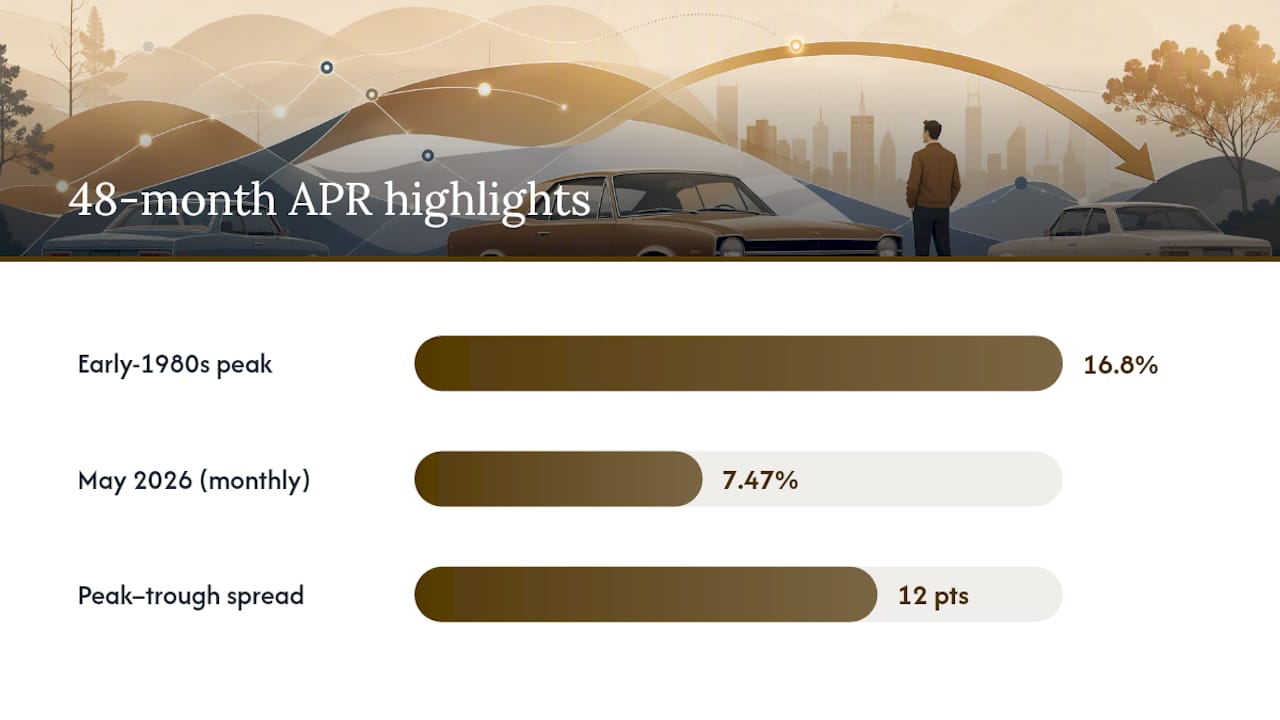
Old car loan rates tell a clear story: after peaking near 8% in late 2023, average new-car APRs have eased to 7.47% as of May 2026, still well above the 4.19% low from 2015 but nowhere near the 16.83% you’d have faced in 1982. Used-car APRs have always run higher, often several points above new-car rates, and your credit tier decides which end of that range you land on. If you’re staring down an old loan or a dealer’s quote today, that history says one thing: check your number against real benchmarks before you assume it’s fair.
TL;DR:
- Current new-car APRs are around 7.47%, down from a peak near 8% in late 2023, but still significantly higher than the 4.19% in 2015.
- Historically, car loan rates have swung widely, with 1982 rates exceeding 16%, and they generally track the federal funds rate plus a 4 percentage point risk spread.
- Used-car APRs remain higher than new-car rates, typically an additional 2 to 5 points above the federal funds rate, due to higher depreciation unpredictability and borrower credit scores.
- If your existing rate is more than two percentage points above current average rates for your credit tier and you have at least two years remaining, refinancing could save money after factoring in fees.
- Always verify your dealer’s quoted rate against personalized benchmarks and public data before signing, as national averages do not reflect individual credit and vehicle specifics.
Table of Contents
- Historical Old Car Loan Rates: The Full Timeline From 1972 to 2026
- Why Old Car Loan Interest Rates Moved the Way They Did
- What Old Car Loan Rates Mean If You’re Still Paying One Off
- Where to Find and Verify Historical Auto Loan Data Yourself
- Turning a National Average Into Your Actual Negotiation Target
- Practical Steps for Negotiating With Historical Rate Context
- Why Baywall Treats Historical Data as a Starting Point, Not the Answer
- Get an Instant Read on Your Dealer’s Rate Offer
- Sources
Historical Old Car Loan Rates: The Full Timeline From 1972 to 2026
The Federal Reserve has tracked new-car loan rates since 1972 through its G.19 consumer credit report, and the 48-month new-car APR series is the closest thing to a definitive historical record for auto financing in the United States. This is the series economists and journalists cite when they talk about “the average car loan rate” over time, and it’s worth knowing by name: TERMCBAUTO48NS.
The numbers swing more than most people expect. The annual average peaked during the early 1980s, during Paul Volcker’s fight against runaway inflation, when the federal funds rate itself was very high. Rates then spent four decades grinding lower, with a few bumps along the way, until they bottomed out in 2015. That’s a 12-point spread between the worst year on record and the best one. If you financed a car in 1982, you were paying triple the rate a 2015 buyer locked in for the same loan structure.
Used-car financing tells a related but distinct story. FRED’s series for used-car loans at finance companies (RIELPCFAUNM) only goes back to 2008, but it consistently runs several percentage points above the new-car bank series across that entire window. Bankrate’s Monitor index for 48-month used-car loans, tracked separately as BRMALR0101, offers a weekly view that catches shifts faster than the Fed’s monthly bank survey.
Here’s a snapshot of where new-car APRs have landed at key points in the historical record:
A few things matter when you read a table like this:
- A “monthly reading” (like May 2026’s 7.47%) captures a single snapshot and can move week to week with Fed policy and lender competition.
- A “calendar-year average” smooths out those swings and is better for comparing one year against another.
- Neither figure tells you what you’d pay. That depends entirely on your credit tier, loan term, and the specific vehicle.
- Used-car rates aren’t seasonally adjusted in most public series, so month-to-month comparisons can be noisy.
Statista’s compiled chart of 60-month new-car loan rates from 2014 to 2026 is a useful visual cross-check if you want to see the trend without pulling raw FRED data yourself, though it’s worth remembering that Statista aggregates rather than originates the numbers.
Why Old Car Loan Interest Rates Moved the Way They Did
Auto APRs don’t move in a vacuum. They track the federal funds rate, but they never match it exactly, and the gap between the two tells you almost as much as the headline number itself.
When the Fed hiked rates aggressively in 1980 to 1982 to strangle inflation, auto loan rates followed almost lockstep, which is how you get a 16.83% average in a single year. The same pattern repeated on a smaller scale during the 2004 to 2006 tightening cycle, the 2015 to 2018 hikes, and again starting in March 2022, when the Fed raised rates seven times in a single year to fight post-pandemic inflation. Each time, auto lenders passed the cost of borrowing straight through to buyers within a few months.
What lenders add on top of the Fed’s rate is called the credit-risk spread, and it exists because auto loans carry default risk that Treasury bonds don’t. According to an analysis of the full 1972 to 2026 record, the 48-month new-car APR has averaged roughly 4 percentage points above the federal funds rate across that entire span. That spread isn’t fixed. It widens when lenders get nervous about defaults, which is exactly what happened during the 2008 to 2009 financial crisis, when used-car values swung wildly and lenders tightened underwriting even as the Fed cut rates to near zero.
Used-car rates carry an extra layer of risk that new-car loans don’t. A few dynamics specific to the used market push those APRs higher:
- Used-vehicle values are harder to predict than new-car values, since depreciation curves vary by make, model, and mileage.
- Borrowers financing used cars skew toward lower average credit scores than new-car buyers.
- Private-party used-car purchases often carry higher rates than dealer-financed used purchases, since fewer lenders compete for that business.
Average spread across the historical record: roughly 4 points above the federal funds rate for new cars, with used-car APRs typically running another 2 to 5 points above that, based on the FRED used-car finance series.
What Old Car Loan Rates Mean If You’re Still Paying One Off
If you financed your car years ago, the rate you locked in was shaped by exactly the forces above, and knowing where you sit relative to the historical curve tells you whether refinancing is worth the paperwork.
Experian’s Q1 2026 data puts the average new-car APR at roughly 6.39% and used-car APR at roughly 11.43%, but those are blended averages across every credit tier. A borrower with a superprime score might see used-car rates in the 6% to 7% range, while someone in the subprime tier could see 18% or higher on the exact same vehicle. That spread is the single biggest reason two people can drive the same car off the same lot and pay wildly different amounts over the life of the loan.
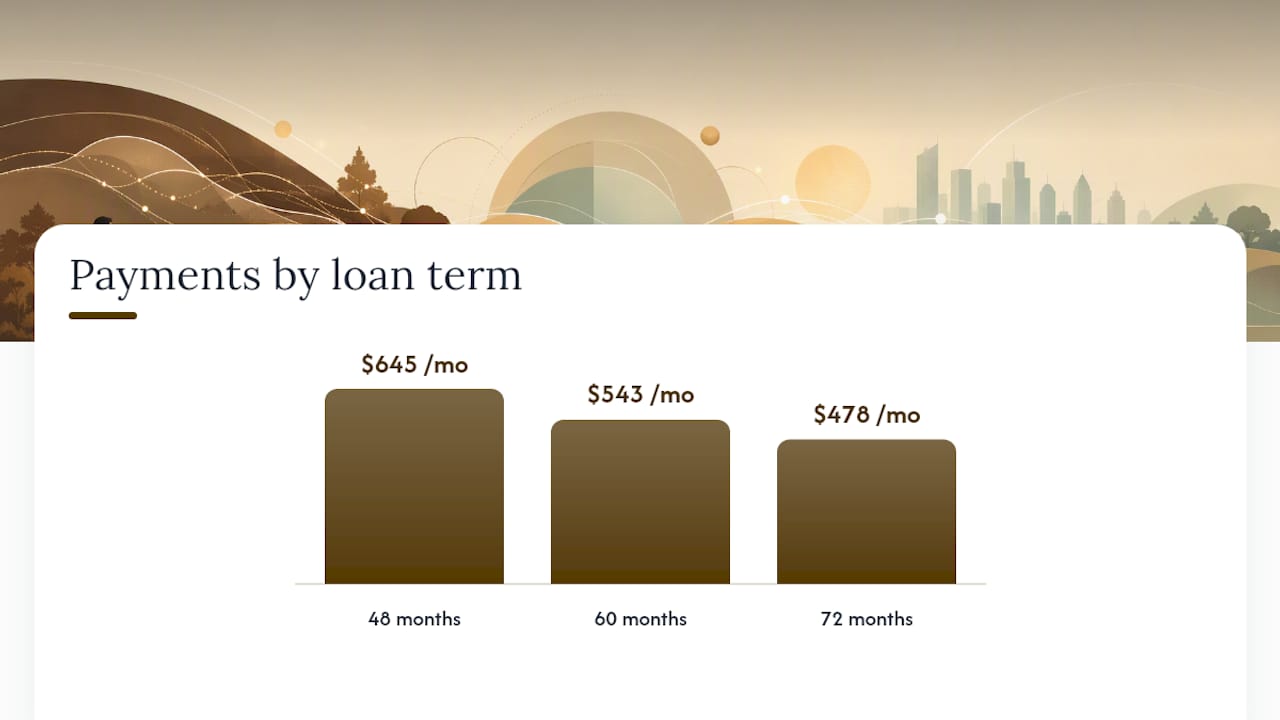
Term length compounds the effect. Here’s what changes when you stretch a $25,000 used-car loan across different terms at a representative 11% APR:
- 48 months at 11% APR runs roughly $645 a month and about $5,950 in total interest.
- 60 months at 11% APR drops to roughly $543 a month but pushes total interest to around $7,600.
- 72 months at 11% APR falls to roughly $478 a month while total interest climbs past $9,400.
Longer terms lower your payment but raise your total cost, which is exactly the kind of tradeoff Experian’s guidance points buyers toward when weighing affordability against total loan cost.
If your existing rate sits two or more percentage points above what current market data shows for your credit tier, and you have at least two years left on the loan, refinancing is usually worth exploring once you factor in any fees. Older loans on longer terms are the ones most likely to have quietly accumulated excess interest, and borrowers who bought during a high-rate window like late 2023 or early 2024 are prime candidates for a second look. Our breakdown of current used car loan benchmarks walks through where today’s rates sit by comparison.
Pro Tip: Pull your original loan disclosure and compare your APR against the credit tier you’d qualify for today, not the tier you were in when you signed. A credit score bump of even 40 to 50 points can move you into a materially cheaper bracket.
Where to Find and Verify Historical Auto Loan Data Yourself
If you want to check these numbers rather than take a blog’s word for it, the primary sources are all public and free.
- FRED’s TERMCBAUTO48NS series gives you the full new-car annual history back to 1972, downloadable as a CSV with one click.
- FRED’s RIELPCFAUNM series covers used-car finance company rates monthly from 2008 forward.
- Bankrate’s BRM index adds a weekly, market-facing view that catches shifts faster than the Fed’s monthly bank survey.
- Statista’s compiled chart works as a quick visual reference, though it aggregates rather than originates its numbers.
To pull the data yourself, visit the FRED Automobile Loan Rates category page, select the series you want, and use the “Download” button to export a CSV with your chosen date range. You can view a single month’s reading or let FRED’s tools compute a calendar-year average automatically.
A few caveats matter before you cite these numbers anywhere official. None of these series are seasonally adjusted, so month-to-month comparisons can be noisy. FRED occasionally revises historical figures as source surveys update. And a single-month observation, like May 2026’s 7.47%, should never be treated as interchangeable with a full calendar-year average when you’re making a year-over-year comparison.
Turning a National Average Into Your Actual Negotiation Target
A historical chart tells you where the market has been. It doesn’t tell you whether the 9.5% your dealer just quoted is fair for your specific situation, and that gap is exactly where a personalized benchmark earns its keep.
Baywall takes the same category of data these public series track, credit tier, loan amount, term, and vehicle type, and narrows it down to transactions that actually match yours. Enter your credit score, the vehicle, your loan amount and term, and the APR your dealer offered, and Baywall compares that offer against real deals from borrowers in your same credit tier financing similar vehicles. The output is a label (great, fair, or high), a specific target APR to negotiate toward, and an estimated dollar savings if you push back.
If your credit score puts you solidly in the prime tier, a raw average tells you almost nothing useful. A tool like Baywall’s analyze report narrows that down to what people in your actual tier and vehicle category paid, which turns a vague historical reference point into an actual number you can put on the table at the dealership.
Practical Steps for Negotiating With Historical Rate Context
Knowing where rates have been only pays off if you use it at the right moment, which is before you sign anything.
- Get preapproved first. Consumer Reports recommends securing a preapproval from a bank or credit union before you ever walk onto a lot, since dealer-arranged financing frequently includes a markup on top of the lender’s actual rate. Comparing offers from a credit union alongside your dealer’s quote gives you real leverage.
- Bring your numbers to the table. Show the dealer your preapproved rate, your credit tier, and a benchmark figure for your vehicle type. Ask directly whether they can beat it, and let silence do some of the negotiating.
- Apply the refinance rule of thumb. If refinancing would cut your rate by two or more percentage points and you have more than a year left on the loan, run the math including any application or title fees before committing. If the spread is under a point, or your loan is nearly paid off, it’s usually not worth the paperwork.
- Watch for red flags in dealer financing, including a rate that changes after you’ve agreed on a vehicle price, add-on products bundled into the loan amount without a clear breakdown, or a term pushed to 72 or 84 months mainly to disguise a high APR behind a lower monthly payment.
Managing your credit utilization ratio in the months before you shop can also move you into a better tier, since utilization is one of the fastest-moving factors in most credit scoring models.
Pro Tip: If a dealer won’t show you the buy rate their lender actually offered, that’s usually a sign there’s a markup baked into your quote. Ask for it directly. You’re entitled to know.
Why Baywall Treats Historical Data as a Starting Point, Not the Answer
We built Baywall because a national average, no matter how well-sourced, can’t tell you what you personally should pay. FRED and Bankrate give you the honest long-run picture, and we lean on that data constantly. But the borrower standing in a dealership finance office needs a number specific to their credit tier, their vehicle, and their moment in the market, not a 50-year average.
That’s the gap between public series and personalized benchmarking, and it’s the entire reason our tool exists. Use the historical context in this article to understand the forces shaping your rate, then verify your specific offer against real comparable transactions before you sign. Check more than one source. Trust the number that matches your actual situation, not the one that’s easiest to find.
— Baywall
Get an Instant Read on Your Dealer’s Rate Offer
Baywall is the fastest way to find out if your dealer’s quoted APR is actually competitive for your credit tier, not just “close enough” to a national average you found in a chart.
The report tells you whether your offer is great, fair, or high, gives you a specific target APR to push toward, and estimates your potential dollar savings if you negotiate. Most buyers get a free basic snapshot, and the full instant report runs $2.99, delivered online the moment you submit your details. If you haven’t already secured a preapproval, get one from your bank or credit union first, then run your dealer’s number through Baywall’s analyze tool before you sign anything.
Sources
- Table Data - Finance Rate on Consumer Installment Loans at Commercial Banks, New Autos 48 Month Loan | FRED | St. Louis Fed
- Table Data - Average Finance Rate of Used Car Loans at Finance Companies, Amount of Finance Weighted | FRED | St. Louis Fed
- Used car loans and financing | Experian
- How to finance a used car and save big on your auto loan | Consumer Reports
This article is general information, not a substitute for advice from a qualified financial advisor. Consult a qualified financial professional about your own circumstances before acting on anything here.