Good Car Loan Rate: What You Should Pay by Credit Tier

A good car loan rate is one at or below the market average for your credit tier and vehicle type. Right now, that means roughly the average APR reported by Experian for new and used cars if you have solid credit, based on Experian’s Q1 2026 data. If the dealer’s quoted APR is within 0.5 percentage points of the benchmark for your tier, it’s roughly competitive. If it’s more than a full point above, you likely have room to negotiate or walk.
Quick benchmarks by credit tier:
| Credit Tier | Score Range | Avg New Car APR | Avg Used Car APR |
|---|---|---|---|
| Super-prime | Super-prime tier | About 5.18% | About 7.26% |
| Prime | Prime tier | About 6.11% | About 8.81% |
| Nonprime | Nonprime tier | About 8.04% | About 13.06% |
| Subprime | Subprime tier | About 10.56% | About 17.07% |
| Deep subprime | Deep subprime tier | About 13.26% | About 19.74% |
These quantitative benchmarks use Experian’s Q1 2026 averages for each tier; your actual rate will vary by lender, term, and location.
These qualitative benchmarks are based on quarterly averages; your actual rate will vary by lender, term, and location.
TL;DR for the dealership:
- Pull your credit score before you go.
- Look up your tier’s benchmark APR in the table above.
- If the dealer’s number is more than 1 percentage point above that benchmark, push back or show a competing pre-approval.
Pro Tip: Ask the finance manager for the “buy rate” — the rate the lender actually approved. The dealer’s quoted APR may be higher. That gap is profit for the dealer, not a fixed cost for you.
Table of Contents
- What current average APRs actually look like right now
- Why your quoted APR can differ from the market average
- Is your quoted APR actually good? Quick checks and real-dollar examples
- How to get a lower APR before you sign
- How to compare a dealer quote to outside offers fairly
- How a benchmarking report answers “is this APR fair?”
- Key Takeaways
- The real cost of skipping the benchmark
- Get a personalized APR benchmark before your next negotiation
- Where these numbers come from
What current average APRs actually look like right now
Experian’s Q1 2026 figures put the overall average at 6.39% for new cars and 11.43% for used cars across all credit tiers combined. The Federal Reserve’s G.19 Consumer Credit release tracked the average finance rate for new car loans at 6.08% in March 2026, a slight dip from 6.13% in December 2025. Market aggregator snapshots from July 2026 show new-car offers still clustering in the mid-6% range for well-qualified buyers, while used-car APRs push into double digits across most tiers.
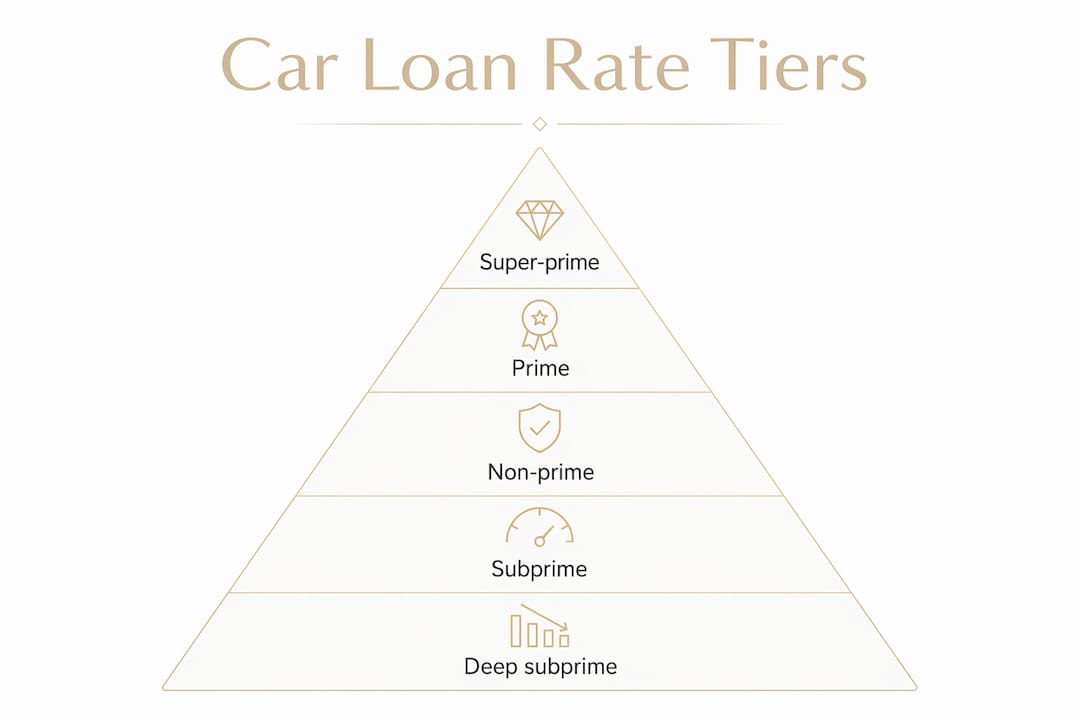
The single biggest practical gap: used-car APRs run several percentage points higher than new-car APRs at every credit tier. A prime borrower might see a moderate APR on a new vehicle and a higher APR on a used one. That difference on a typical loan can add up to hundreds of dollars in extra interest.

APR benchmarks by tier and vehicle type:
| Credit Tier | New Car APR | Used Car APR | Data Source |
|---|---|---|---|
| Super-prime (Super-prime tier) | 5.18% | 7.26% | Experian Q1 2026 |
| Prime (Prime tier) | 6.11% | 8.81% | Experian Q1 2026 |
| Nonprime (Nonprime tier) | 8.04% | 13.06% | Experian Q1 2026 |
| Subprime (Subprime tier) | 10.56% | 17.07% | Experian Q1 2026 |
| Deep subprime (Deep subprime tier) | 13.26% | 19.74% | Experian Q1 2026 |
A few things worth noting about these numbers:
- Experian’s figures are quarterly averages across all lenders and loan types — they reflect completed transactions, not advertised minimums.
- LendingTree offer data and aggregated lender snapshots often show a wider range, because they capture live offers including promotional rates.
- Super-prime borrowers saw new-car APRs in the mid-4% range earlier in 2026, before broader market conditions pushed averages slightly higher.
The quarterly cadence matters. Experian updates its averages every three months, so a rate that looked competitive in January may be slightly off by April. Check the most recent quarter before you negotiate.
Why your quoted APR can differ from the market average
No two borrowers get the same rate, even with identical credit scores. Lenders weigh several variables simultaneously, and understanding which ones you can control is where negotiating power comes from.
The primary drivers:
| Factor | Direction | Notes |
|---|---|---|
| Credit score / tier | Higher score = lower APR | The single biggest lever |
| Loan term | Longer term = higher APR | 72-month loans carry more risk for lenders |
| Vehicle age | Used = higher APR | Older collateral depreciates faster |
| Down payment | Larger down = lower APR | Reduces lender’s loan-to-value exposure |
| Loan amount | Very small or very large = higher APR | Lenders price outliers differently |
| Lender type | Credit union often lowest; dealer often the highest | Dealer adds markup above buy rate |
| Location | State regulations and local competition affect rates | Minor but real |
| Subvented financing | Manufacturer-subsidized rates can be very low | May require forgoing cash rebates |
The factor buyers most often overlook is the dealer markup, also called dealer reserve. When a dealer arranges financing through a lender, the lender approves a buy rate. The dealer is then permitted to quote you a higher rate and keep the difference. That markup can be anywhere from a fraction of a point to several full percentage points, and it’s entirely negotiable.
Market conditions and Fed policy also shift the baseline. When the Federal Reserve raises or holds rates, lender cost-of-funds rises, and average APRs follow. Quarterly data captures these shifts, but your individual quote reflects the lender’s current risk appetite on top of that baseline.
Pro Tip: Manufacturer subvented rates (e.g., 0% or 1.9% financing on a new model) can look unbeatable, but they sometimes require you to forgo a cash rebate. Calculate the total cost both ways — rebate plus a market-rate loan vs. the subvented rate with no rebate — before deciding which is cheaper.
Is your quoted APR actually good? Quick checks and real-dollar examples
The fastest way to judge a quote is to convert the APR difference into dollars. A rate that sounds close on paper can cost you a meaningful amount over a 60-month term.
Step-by-step checklist:
- Confirm your credit tier using your VantageScore or FICO score before visiting the dealer.
- Identify whether the vehicle is new or used — the benchmark APR differs substantially.
- Record the exact loan amount (purchase price minus down payment and trade-in), the term in months, and the dealer’s quoted APR.
- Ask the finance manager for the buy rate — the rate the lender approved before any dealer markup.
- Get at least one pre-approval from a credit union or bank before you sign anything.
Three sample calculations (60-month term, $30,000 loan):
Profile A: Prime borrower, new car
- Benchmark APR: 7.0% → Monthly payment: ~$594, Total interest: ~$5,640
- Dealer quote: 8.5% → Monthly payment: ~$616, Total interest: ~$6,960
- Difference: $22/month, $1,320 over the loan
Profile B: Nonprime borrower, used car
- Benchmark APR: 14.0% → Monthly payment: ~$698, Total interest: ~$11,880
- Dealer quote: 17.0% → Monthly payment: ~$739, Total interest: ~$14,340
- Difference: $41/month, $2,460 over the loan
Profile C: Super-prime borrower, new car
- Benchmark APR: 5.0% → Monthly payment: ~$566, Total interest: ~$3,960
- Dealer quote: 6.5% → Monthly payment: ~$586, Total interest: ~$5,160
- Difference: $20/month, $1,200 over the loan
That $1,200 to $2,460 gap is a vacation, a year of car insurance, or a solid emergency fund contribution. The math makes the case for negotiating even when the rate “seems fine.”
Getting at least two pre-approval offers from different lender types before you visit the dealer gives you a concrete baseline to measure the dealer’s quote against — and a ready alternative if the dealer won’t budge.
How to get a lower APR before you sign
These steps are ordered by expected impact. Do the top ones first.
- Improve your credit score before applying. Even moving from a 659 to a 661 shifts you from nonprime to prime, which can cut your APR by 3 or more percentage points. Pay down revolving balances and dispute any errors on your report at least 60 days before applying.
- Get pre-approved by a credit union. Navy Federal and similar credit unions publish “as low as” APRs that frequently undercut bank and dealer offers for qualified borrowers. Navy Federal’s published rates start at 3.89% APR for new cars on shorter terms.
- Get a second pre-approval from a bank or online lender. Two competing offers create real leverage. Walk into the dealership with both in hand.
- Choose a shorter loan term. A 36-month or 48-month loan typically carries a lower APR than a 72-month loan, because the lender’s risk window is shorter. The monthly payment is higher, but total interest paid is substantially lower.
- Increase your down payment. Putting more down reduces the loan-to-value ratio, which lowers lender risk and often earns a better rate. A 20% down payment is a reasonable target.
- Time your purchase strategically. End-of-month and end-of-quarter periods often bring dealer incentives and more flexible financing terms as sales teams work toward targets.
- Negotiate the APR separately from the vehicle price. Dealers sometimes bundle the two to obscure markups. Settle on the vehicle price first, then discuss financing.
Red flags that suggest a dealer markup or bait-and-switch:
- The dealer won’t tell you the buy rate.
- The quoted APR is more than 1.5 percentage points above your pre-approval offer.
- The finance manager says the rate “can’t be changed” without explanation.
- The monthly payment is emphasized while the APR and total cost are downplayed.
Pro Tip: When you have a pre-approval in hand, tell the finance manager: “I have a pre-approval at X%. Can you beat it?” That single sentence shifts the negotiation from “what rate will you accept?” to “can you do better than my existing offer?” It’s a more powerful position.

How to compare a dealer quote to outside offers fairly
An apples-to-apples comparison requires more than lining up two APR numbers. Fees, terms, and loan amounts all affect the real cost.
Dealer data to collect before comparing:
- The buy rate (lender’s approved rate, before dealer markup)
- Any fees rolled into the loan (documentation fee, GAP insurance, extended warranty)
- The exact loan amount after your down payment and trade-in credit
- The loan term in months
- For used cars: the vehicle’s VIN, mileage, and odometer statement
Steps to normalize the comparison:
- Use the same loan amount for both offers (strip out any add-ons the dealer rolled in).
- Use the same term in months.
- Calculate the total finance charge (total repaid minus principal) for each offer.
- Compare total finance charges, not just monthly payments — a lower payment on a longer term can cost more overall.
Sample side-by-side comparison ($28,000 loan, 60 months):
| Offer | APR | Monthly Payment | Total Interest | Total Cost |
|---|---|---|---|---|
| Credit union pre-approval | 6.5% | — | — | — |
One caution: pre-approval rates can shift before final funding. A pre-approval is a conditional offer, not a locked contract. The final rate is confirmed only when the lender underwrites the specific vehicle and verifies all details at closing.
How a benchmarking report answers “is this APR fair?”
Comparing your quote to a published average is a start, but averages don’t account for your specific credit tier, vehicle, loan amount, term, and location simultaneously. A personalized benchmark does.
The workflow:
- Submit your quote details. Enter your credit score, vehicle (year, make, model), loan amount, loan term, and the dealer’s quoted APR.
- Match to comparable transactions. The report pulls data from similar deals — same credit tier, same loan type, similar vehicle — not a broad market average.
- Receive a target APR and classification. The report labels your offer as great, fair, or high, and gives you a specific target APR to negotiate toward.
- Calculate your dollar savings. The report shows the dollar difference between the dealer’s rate and the target rate over the full loan term.
- Use the report in negotiation. Walk into the finance office with a printed or digital benchmark showing the market rate for your exact profile. That’s a different conversation than saying “I think the rate seems high.”
What a useful benchmark report should include:
- A clear label: great, fair, or high relative to comparable transactions
- A specific target APR (not just a range)
- Estimated dollar savings over the loan term
- Comparable vehicle pricing data for additional negotiation context
The core value is information asymmetry reduction. Dealers negotiate car loans every day. Most buyers do it a handful of times in their lives. A report that shows the market rate for your exact profile levels that gap in a concrete, documentable way.
Key Takeaways
A good car loan rate is one at or below the market average for your credit tier and vehicle type — and knowing that benchmark before you sign is the difference between a fair deal and leaving money on the table.
| Point | Details |
|---|---|
| Know your benchmark APR | Experian Q1 2026 averages: 6.39% new, 11.43% used — find your tier’s number before negotiating. |
| Used cars cost more to finance | Used-car APRs run several points higher than new-car APRs at every credit tier; budget accordingly. |
| Get two pre-approvals first | A credit union and a bank offer create real leverage and reveal whether the dealer’s rate includes a markup. |
| Convert APR to dollars | A 2-point APR difference on a $30,000 loan over 60 months can mean $1,200–$2,460 in extra interest. |
| Baywall benchmarks your exact quote | Enter your credit score, vehicle, and dealer APR at Baywall to get a target rate and dollar-savings estimate before you sign. |
The real cost of skipping the benchmark
Most car buyers spend more time researching the vehicle than the financing. That’s understandable — the car is tangible, exciting, and visible. The APR is a number buried in a contract. But the financing decision often has a larger dollar impact than the color or trim level you agonized over.
The data makes this plain. A prime borrower who accepts a dealer-quoted 8.5% instead of negotiating to the 7.0% benchmark on a $30,000 loan pays an extra $1,320 over 60 months. For a nonprime borrower on a used car, that gap can exceed $2,000. Neither of those buyers did anything wrong — they just didn’t have the benchmark in front of them when it mattered.
What Baywall does is put that benchmark in your hands before you sign. Not a broad market average, but a rate derived from comparable transactions for your specific credit tier, vehicle, and loan profile. That’s the number that belongs in the negotiation, and it’s the number most buyers never see.
Get a personalized APR benchmark before your next negotiation
You’ve done the research. You know your credit tier, you understand the market averages, and you know that a 2-point APR gap can cost you more than $1,000. The next step is getting a benchmark that’s specific to your deal — not a general range, but a target APR built from comparable transactions for your exact profile.
Baywall’s report costs $2.99 and delivers instantly. Enter your credit score, vehicle details, loan amount, term, and the dealer’s quoted APR. The report tells you whether that offer is great, fair, or high, gives you a specific target APR to negotiate toward, and shows your potential dollar savings over the loan term. It also includes comparable vehicle pricing data, so you’re prepared on both the car price and the financing.
Your data is used only to generate your report — no spam, no sales calls. The report arrives the moment you submit. Run your APR through Baywall before you sign anything.
Where these numbers come from
The figures in this article draw from three primary sources, each with a different scope and update cadence.
-
Experian (quarterly averages): Experian compiles auto loan data from completed transactions and publishes average APRs by VantageScore credit tier, broken out by new and used vehicles. Updated quarterly, these figures reflect what borrowers actually paid — not what lenders advertised. Best used for: understanding where your credit tier sits relative to the market.
-
LendingTree (offer distribution): LendingTree aggregates lender offers submitted through its platform, giving a view of the range of rates available at a given moment. Because these are offers rather than closed loans, they can skew lower than Experian’s transaction averages. Best used for: understanding the spread of available rates and identifying competitive offers.
-
U.S. News / Cars and market aggregators: Publications like U.S. News compile and repackage Experian, LendingTree, and lender-published data into accessible summaries. Update cadence varies — some monthly, some quarterly. Best used for: quick orientation and cross-checking figures across sources.
| Source | What It Measures | Update Cadence |
|---|---|---|
| Experian | Completed transaction averages by credit tier | Quarterly |
| LendingTree | Lender offer distribution | Near-real-time / monthly |
| U.S. News / Cars | Aggregated reporting across sources | Monthly / quarterly |
| Federal Reserve | Finance company new-car loan rates | Monthly |
The practical takeaway: if Experian’s quarterly average and a live aggregator snapshot differ by a point or two, that’s normal. Use Experian’s tier-specific averages as your negotiation baseline, and treat aggregator snapshots as a directional check on whether the market has moved since the last quarterly update.